Showing posts with label Transportation. Show all posts

Monday, December 21, 2015

That 70s Urbanism

1970s suburb, Birmingham, AL.
The 70s, as much as any decade from the 1920s to the 1990s, has gotten a bad rap in contemporary urban planning circles.  It was the golden age of the suburb and the nadir for many urban areas around the United States, not to mention a boom time for highway construction and the development of very low density suburbs on non-gridded street patterns.  Surely there is nothing we can glean from this time period that has applicability to the urbanism of today?

Well, this is perhaps not entirely true.  The 1970s, as well as the decade before it, arguably represented the first time in the urban history of America that planners self-consciously pursued entirely pedestrianized environments, although the inspiration for these areas went back to flights of imagination from the 1920s if not earlier, and the 1950s saw the genesis of several of these ideas, at least in their embryonic forms.    I refer not only to pedestrianized main streets, but to the five great pedestrian creations of the age: the enclosed shopping mall, the international airport, the vacation resort, the convention center, and the network of tunnels and/or skyways.  Each of these represented a vision, if incomplete, for pedestrian-only circulation and commerce on a grand scale, often on the footprint of a small town.  

Do I jest?  No.  The future, if the human imagination is a key to the future, was pointing toward pedestrianism in the 1960s and especially 1970s.  This was, after all, the age of Paulo Soleri's implicitly pedestrian-centric arcology.  Gas prices were soaring by the early 70s.  The 1939 World's Fair vision of high-speed highways was out, and a more refined tecnho-utopianism involving futuristic megastructures was in.  The great majority of the buying public rejected this vision for their private lives, but as the success of enclosed malls shows, they gladly embraced it in many other contexts -- in commerce, for employment, in travel and for recreation.  

The arcology: no highways here, or at least, not the central element! Source.
The tunnel system of Houston and the skyway system of Minneapolis, both begun in earnest in the 1960s, were built out through the 1970s.  Enclosed mall construction, which began in 1956, was in such a boom that four enclosed malls opened from 1969 to 1980 in the city of Toledo, Ohio alone.  Air travel multiplied through the 1960s and airports were expanded on an unprecedented scale.  The very idea of the convention center, although it had been around for decades, attained gargantuan scale by the latter half of the 20th century.  

The hostility toward these type of environments in recent years, has, it seems to me, been based on two primary grounds: 1) the environments, being private and privately controlled, are corporate and sterile; and 2) although the environments themselves may be pedestrian, they are dependent for their business on car-driving customers.  Of these two critiques, however, the second is not inherent to the form of the structures themselves.  Rather, a pedestrian environment such as a tunnel system or an enclosed mall is, as the cities of Japan or Korea bear witness, a better partner to transit and walking trips than it is to car transport.  That the United States largely squandered its opportunities to integrate these structures and systems into its transit networks is an indictment of city planning, but not necessarily of these forms themselves.  

The Japanese, arguably the best city-builders in the world, have not missed this point, and typically have built shopping malls either adjacent to or, in the case below, on top of railway stations:

Osaka's Keihan Mall, over the Kyobashi railway station. Bing Maps.
In the case of American cities, even where the option is obvious and available, no such plans are made.  In Stamford, Connecticut, where nearly the entire downtown was condemned and bulldozed in a vast urban renewal scheme, the new enclosed mall built by the city's hand-picked developer was inexplicably not located next to the city's heavily-used Metro North railway stop:

The mall, at top right, and station, at bottom left.  Bing Maps.
What were they thinking, one could ask.  Note also the very low value placement of the interstate highway just north of the railway line, although this area probably had higher property values than the south side of the tracks at the time of the highway's construction.  In truth, the Stamford planners had given up entirely on any idea of pedestrian circulation outside the new megablocks.  The curated spaces within the new mall were designed to be accessed by car alone, and the structure to this day presents a fortress-like appearance to the outside.  The decision cannot even be explained by a desire to exclude train riders, who then and now tend to be well-heeled commuters to New York and are in general better off than most.

Had the planners of the 1970s left the city alone, and simply redeveloped the train station as a mall, who knows what might have happened by today?  Yet these questions need not be hypotheticals.  Cities have the power to make these changes today.  Stamford cannot move its mall, but it can consider a new infill station closer to it.  It can consider how to improve pedestrian mobility.  It can revamp its bus network.  It can do many things to address past mistakes, but it must be able to understand its mistakes, and even more importantly understand how these creations of the 1960s and 1970s can be a force for good, not merely magnets for a car-driving public.

There are a few easy steps that can be taken at first.  If Stamford wants to fix its mall, tear down one of the car ramp entrances, already duplicated by two others, and install a prominent pedestrian entrance, like so:
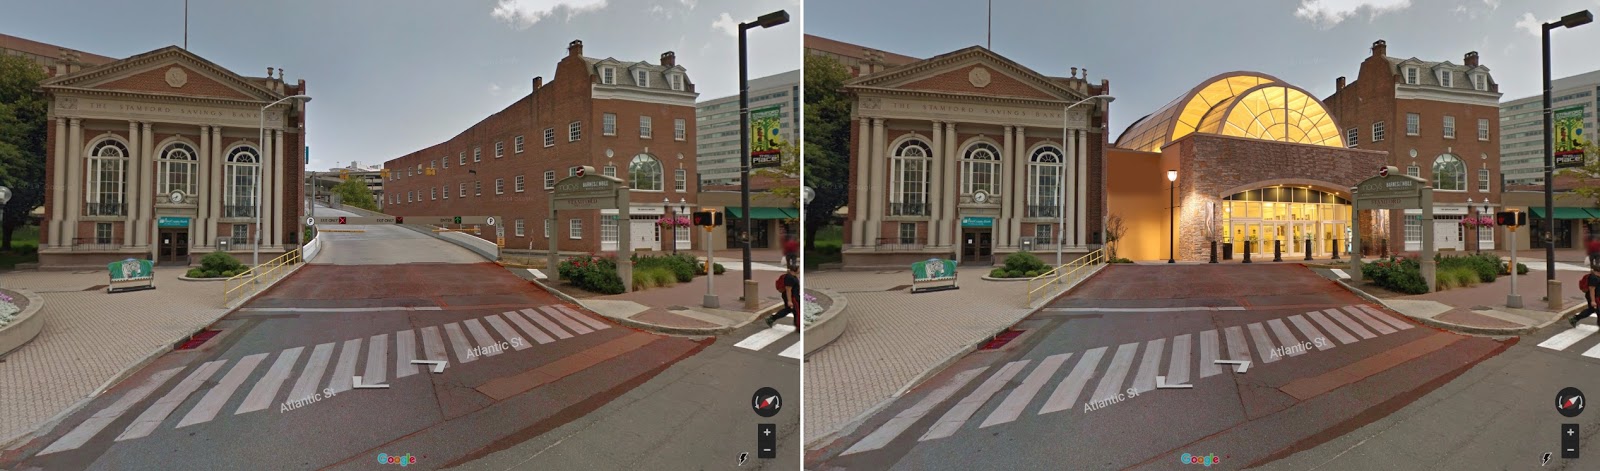

Easy?  In the grand scheme of things, yes.  Expensive?  Not terribly.  A bolder step would be an entirely new infill station, one closer to the mall, perhaps at one of the locations highlighted with a green arrow:


Plan a new station.  New Haven already did it, twice, and Bridgeport is doing it, so this need not be some impossible fantasy.  The overpasses need to be replaced anyways, so merge the projects.  Use the gains in real estate value to improve pedestrian connections.  Narrow the streets.  Add bike lanes.  It need not be that difficult!

If hostility toward the idea of enclosed malls, or skyway systems, or convention centers is retained, however, then cities may or may not succeed at revitalization, but they will squander again an opportunity to use these forces for good rather than ill.

---------------

Other reading:

See Mallville by Andrew Price for a related perspective on the traditional city aspects of the American mall.

Sunday, March 8, 2015

Auto Costs and Housing Costs, or, One Reason the Suburbs are So Appealing

Simon Vallee has a post from some time back about filtering vs. gentrification in which he analogizes the process of gentrification, in North America, to the car market in Cuba, noting that restrictions on supply will tend to boost prices and limit availability of a desired good.  Although the comparison is intended to be illustrative, I think it also highlights a substantive difference which, in effect, subsidizes automobiles at the expense of housing.  First, though, some background.

Going back for a moment to the subject matter of a Nathan Lewis post, we can note that, land costs aside, the sticker price of manufactured housing as compared to a new vehicle is not as different as one might think.  A two-bedroom manufactured home, for instance, of about the size of the average new home of the 1950s, costs only around $41,500 as compared to the price of a popular new sedan (I chose the Altima, one of the best-selling cars in the United States) at around $27,000:


However, when car costs are compared to overall home values, including site-built as well as manufactured homes, a different story emerges.  In 1940, the median home was valued at only 2.3 times the retail price of the average new car.  By 2010, in spite of the crash in home prices, this ratio had risen to 6.4.  Car operating costs have also generally fallen as fuel efficiency and vehicle reliability have improved.  Median rents, not shown here, have grown at an even faster rate than home values.

In short, over the last seven or so decades, car ownership (or leasing) has become dramatically less expensive relative to home ownership or tenancy.  Partly this must be due to labor-saving technologies that have affected car production more than homebuilding: even manufactured homes still require extensive human labor, which has become much costlier (though more productive) since 1940, whereas the formerly labor-intensive car assembly process has been heavily automated and accelerated.  The process of robotically assembling houses, or even apartment buildings, remains in its infancy.

Are long-term, over-inflation increases in home values also linked to increases in land values caused by general urban population increase and restrictive zoning?  It goes without saying that rural land values are lower than urban land values, and the Census homeownership figures show that housing values are lower, and homeownership higher, in more rural states in spite of lower incomes.  Relatively poor and rural West Virginia has the nation's highest homeownership rate, while 100% urbanized Washington D.C. has had its lowest in every Census since 1930.  As Luis Bettencourt writes:
"There are several important consequences for general land use in cities. First, the price of land rises faster with population size than average incomes. This is the result of per capita increases in both density and economic productivity, so that money spent per unit area and unit time, i.e. land rents, increases on average by 50% with every doubling of city population size! It is this rise in the price of land that mediates, indirectly, many of the spontaneous solutions that reduce per capita energy use and Carbon emissions in larger cities. Cars become expensive to park, and taller buildings become necessary to keep the price of floor space in pace with incomes, thus leading to smaller surface area to volume."   The Kind of Problem a City Is.
Urbanization in the era of the automobile in turn causes frictions which lead to pressure for zoning.  American municipal zoning, in its initial formulation and as is still practiced today, is fundamentally a device to politically manage these frictions by restricting the intensity of residential land use.  Though not its stated purpose, it has the effect of increasing land scarcity that is already inherent in the urbanization process, and thereby provides a positive feedback mechanism that puts additional pressure on housing values.

What does this all have to do with cars?  As noted above, the cost of a manufactured home, in isolation, is only slightly more than that of a typical sedan.  As urbanization increases, however, the increasing value of land makes cars, which do not have their land storage cost bundled into the sticker price (unlike Japan does, effectively), seem like a relative bargain.  Some time ago, Cap'n Transit wrote a fascinating series on how New York came to tolerate and eventually permit free overnight on-street parking in the late 1940s and early 1950s.  We would find it ludicrous if someone were to purchase a manufactured home and to drive it into Manhattan on a flatbed expecting the city to provide free land on which to site it, but that was how the story went with cars:
"This [middle-class] conception of the benefits of car ownership has always had a huge bait-and-switch component to it. In New York City in the 1940s it was no exception. When people looked at the price of a car, they didn't figure in $20-35 per month in garage rental. When they got their cars, many couldn't afford to pay and took their chances on the street. Garage owners now had to compete with free street parking and lowered their rates accordingly, which meant that they didn't have enough income to expand their facilities, and resorted to bribing the police. 
"These social-climbing drivers felt cheated, but they didn't take their anger out on the car dealers. No, they felt that the city owed them the free parking necessary to make their cars as affordable as they thought." The right to free parking in 1940s New York
There are therefore two clashing trends: as cities grow in size, the cost of a buying a car declines relative to increases in income and housing cost, yet the actual cost of storing a vehicle is, or should be, increasing rapidly, since cars, like houses, occupy a significant amount of valuable space.  Rather than taking the common-sense Japanese approach of the shako shomeisho (proof of parking), however, American states and cities have engaged in onerous mandatory inclusionary zoning for cars (parking minimums), zoning exemptions (e.g. not counting garages toward FAR limits and allowing parking, but not housing, in mandated setbacks), tax exemptions (only 16 states maintain a personal property tax that covers automobiles) and fringe benefits (the commuter parking benefit), in addition to rent-free public housing for cars (overnight on-street parking).  Whereas in 1940, buying and operating a car to escape urban housing costs simply shifted the balance of expenses, with a car costing almost half as much as the median home, in 2010 the prospect of doing so was much more economically feasible.  No doubt many of those New Yorkers of the 1940s and 1950s eventually drove those cars out of their subsidized parking spaces and off to the far reaches of Nassau, Bergen and Westchester Counties, and who could blame them?

Perhaps the biggest effect of all though, going back to the beginning of the post, relates to the obvious but important point that while housing production, and particularly in-city housing production, is subject to political constraints, car production is not (well, mostly not).  There even seems to be a difference in Americans' moral characterization of those who build homes and cars for profit: while a search for the phrase "greedy developers" returns over 60,000 hits, "greedy automakers" returns only 1,000.  From that perspective, the so-called "drive 'til you qualify" phenomenon, much questioned and criticized, is an entirely reasonable response to this economic reality, particularly given widespread lack of highway tolls. 

Making a full accounting of the political choices that have been made with regard to both housing and transportation is a daunting task, but it does help illuminate the residential patterns we see without the need to resort to moral judgments about those choices.

Related posts: Was the Rise of Car Ownership Responsible for the Midcentury Homeownership Boom in the US?

Saturday, November 1, 2014

Reconciling Bridges and Urbanism

Bridges have been a feature of urban design ever since King Nabopolassar spanned the Euphrates River with a causeway around 620 B.C, joining together the two halves of the city of Babylon and much later inspiring the title of a Rolling Stones album.  That this innovation represented a major improvement over the ferry transportation that had formerly prevailed was evident to ancient observers such as the Greek historian Herodotus, who noted that "under the former kings, if a man wanted to pass from one of these halves to the other, he had to cross in a boat; which must, it seems to me, have been very troublesome." 

If the transportation advantages were clear at the time, the design challenges of incorporating bridges into a dense urban fabric presented difficulties that have continued to the present day.  Apart from engineering challenges, the primary contextual concern is that a bridge high enough to avoid obstructing the flow of maritime traffic will typically be higher than the city itself, with the result that approaches to the bridge, if they are to accommodate wheeled traffic, will need to extend deeply into the city.  Long approaches, however, disrupt and divide the urban fabric, undermining the very connectivity that the bridge was intended to provide.

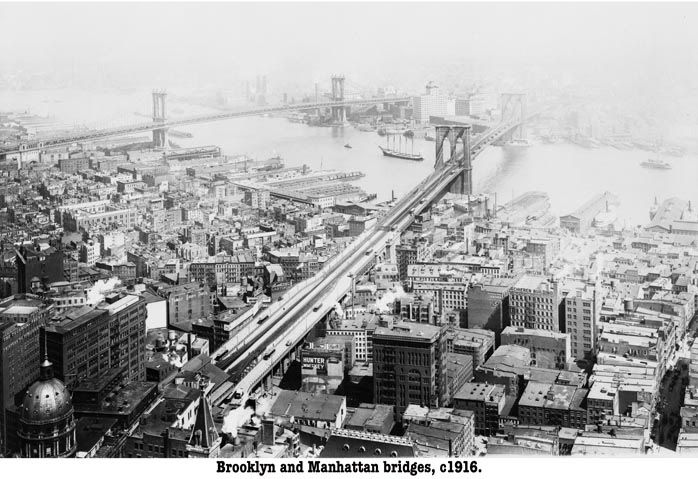
For a well-known example, consider the Brooklyn Bridge, which was built to a height sufficient to accommodate the masts of sailing ships that still plied the East River in the early 1880s, and which, like Nabopolassar's bridge, replaced ferry services.  An engineering marvel, the bridge was nonetheless so massive that its approaches reached deep into the heart of Manhattan, overshadowing many blocks and requiring the demolition of others:

The Brooklyn and Manhattan bridges circa 1916. Source.
Built some years before Robert Moses was even born, the bridge represented the first instance of an elevated roadway carving a swathe through a built-up area of Manhattan and dividing parts of the city from each other.  In the years since the bridge was built, access ramps from the FDR Drive have further expanded the initial scar, leaving a gap of 360 feet in the city's fabric with limited crossing points.  Although the arch spaces under the approach were creatively rented out as storage space for wine merchants (the bricked-in warehouse spaces can still be seen today), the effect on the immediately surrounding neighborhood could hardly have been a great positive.  The area sliced up by the approaches to the Brooklyn, Manhattan and Williamsburg Bridges became notorious as Manhattan's Lower East Side, and was some decades later subjected to some of the most intensive urban renewal in the city.  

In Europe, where watersheds tend to be smaller than those of North America, major rivers narrower and where many bridges had been built long before the advent of suspension or steel-frame technology, a much more complementary design has long prevailed.  Rather than sending approaches deep into the urban fabric, European cities tend to raise masonry embankments directly against the river, allowing a bridge even of substantial height to discharge traffic directly onto riverfront streets.  Bridges were also considered architectural works in their own right intended to be experienced on foot, and incorporated sidewalk lighting, statuary, benches and other pedestrian amenities.


Pont Neuf, Paris. Google Maps.


Bird's eye view of another Pont Neuf, in Toulouse, with its entry point flush with a
 25-foot embankment providing flood protection against the Garonne River. Bing Maps. 
Running along these embankments at just above water level are often found quays, which formerly served the shipping trade but which today have been converted to car expressways or recreational areas for cyclists and pedestrians (a notable conversion from the former to the later has recently taken place in Paris).

In some famous instances, the city itself extended out onto the bridge, turning transportation infrastructure into a bustling city street with shops and homes.  Among the best known of these are the former London Bridge, the Ponte Vecchio and the Rialto Bridge in Venice:


Pont Notre-Dame, Paris, depicted 1756. Source.
Paris seems to have had several such bridges as well, but most had their houses torn down in the late 1700s when the spatial demands of wheeled traffic began to make themselves increasingly apparent in the larger cities of Europe.  The Pont Notre-Dame, above, was scraped clean of its tall dwellings in 1782, and the centuries-old bridge itself was replaced in the 1850s.  London Bridge's houses, apparently allowed onto the bridge as a means of producing rent to offset the cost of bridge construction in the medieval period, were removed in the late 1750s at great expense to improve the bridge's level of service.  The trend toward retrofitting cities around the needs of wheeled traffic would steadily accelerate through the late 20th century.


Source: Old Urbanist.
Some North American cities have bridges in approximately the European fashion, particularly where the city is located on a bluff overlooking a river or where the river is relatively narrow.  Chicago, Milwaukee and San Antonio, in particular, have numerous such bridges over their relatively narrow rivers, and Austin has partial embankments overlooking a riverside trail.  Des Moines, also, has a series of very European-looking bridges.  Even if geography requires a bridge to enter a city at height, however, that does not mean that integrating it into the city need be impossible.

For instance, even if the ground level cannot be raised to meet the bridge, buildings themselves may be constructed up to the bridge level.  The photo at right shows this approach deployed along a Danube River bridge in Regensburg, Germany (actually, in this case, I believe the bridge may have been constructed to align with the second floors of existing apartments).  With this method, similar to the built-upon bridges described above, the bridge adds a second linear dimension to the city rather than simply being a passive structure accessible only at its endpoints.  

Additionally, the long approaches themselves are demanded only by wheeled traffic.  Where a bridge serves only foot traffic, it is possible to provide high clearance, even with masonry construction, and yet have little or no landward approach.  This method was employed abundantly in the towns and cities of pre-modern China, such as Wuzhen, below, where although the bridge appears to rise very steeply, the grade is quite a bit less than in the standard staircase, and the climb less arduous:


Source.
Steep automobile bridges are possible, but rarely seen, as in this example from Matsue, Japan, which fortunately has a fairly mild winter climate:


Source.
The American approach, reflective of the era of Heroic Materialism in general, has typically been to see bridges as engineering projects first, architecture second, and an integrated part of the city third, if at all.  Even where existing bridges with lengthy approaches have been converted to pedestrian use, long approaches are typically retained, or in some cases, even rebuilt.  

The Big Four Bridge in Louisville, Kentucky, a rail bridge over the Ohio River which had its long approaches removed in the late 1960s, leaving only the central span, was inexplicably rebuilt with approaches even though it was intended primarily for pedestrians (a much simpler plan requiring no land acquisition which would have involved a ramp directly around the final bridge pier was apparently rejected).  On the Kentucky side, pedestrians must ascend a massive, circuitous and over-engineered ramp to reach the bridge:  


Google Maps/Shawn Conn.

A switchback staircase leading directly to the bridge pier was present during construction for the convenience of workers according to Streetview imagery, but seems to have been removed now that the approach is complete!

Nashville's downtown Shelby Street Bridge, which never had its approaches demolished prior to its pedestrianization in the early 2000s, took a more sensible approach of adding a steel staircase and elevator, thereby taking advantage of the tremendous spatial efficiencies of pedestrianism while allowing people with bicycles, strollers or in wheelchairs to reach the bridge: 


Google Maps.
In a first step toward directly integrating the bridge roadway with the surrounding buildings, the bridge and elevator are attached by an elevated walkway to the office building at the left.  It is difficult to overstate the effect pedestrian infrastructure like this contributes toward making the bridge feel like a place, rather than an obnoxious intrusion into the life of the city.

Turning bridge design away from the Heroic Materialist model of bridge-building toward a more pedestrian and city-oriented perspective is a long-term process that appears to be underway with bridge conversions, but many positive changes can done incrementally.  Providing pedestrians with shortcut access points to bridge approaches, linking the bridge surface directly to surrounding buildings and even considering construction of new buildings flush with or underneath the bridge, can all help turn bridges into more than simply impressive engineering feats.

Related posts: Jarrett Walker has a similar take on urban viaducts here (h/t to commenter Marc), and of course these observations could also be applied to other forms of elevated infrastructure to greater or lesser degrees.

Wednesday, July 2, 2014

Going Driverless, or Not

A heated debate over the significance of Google's so-called driverless car has been raging over the past several weeks. On one side of the aisle are those hailing it as a "revolutionary" technology that will dramatically alter personal mobility to the point of  eliminating private car ownership. On the other side are those who reject the premise that the technology represents a groundbreaking shift, instead characterizing it as merely a "slightly different variation" on current transportation modes that is "so incremental that it epitomizes our national short-sightedness, and failure of imagination, when it comes to improving mobility in America."

It's difficult to imagine two more divergent positions on the significance of a new technology. Although I'm wary of attempting to forecast the future, knowing how likely it is that any predictions are likely to appear foolish or worse some years down the line, there are enough parallels, current and historic, that I think some general observations can be made here without wandering too far off into pointless speculation.

The human-driven motorized car, itself a recognizable variation on the 5,000 year-old horsecart, must have seemed like a rather mundane idea in the late 19th century — almost a throwback to horse-and-carriage travel that the railroads had put out of business — compared to steam railways, attempts at early aircraft and even the bicycle, which represented the first instance in history of a fast yet human-powered wheeled vehicle. The name for the early cars reflected this mindset, which some have used to argue that driverless cars are also being underestimated, as in this blog post:
"One reason I will eventually move away from my chosen name for the technology — robocar — along with the other popular names like “self-driving car” is that this future vehicle is not a car, not as we know it today. It is no more a “driverless car” than a modern automobile is a horseless carriage. 100 years ago, the only way they could think of the car was not notice there was no horse. Today, all many people notice is that no human is driving. This is the thing that comes after the car."
Could it be that these early observers were right, though? The very early car was slower than the steam trains, and its primary breakthrough was economic: by moving the horse out of the picture, and substituting the combustion of an oil, it became possible to maintain a personal carriage without the the constant care and expense needed for keeping horses. The earliest car ads emphasized the savings in cost, care and anxiety from not having to keep a horse rather than advantages in speed. It took several more decades until the velocities enabled by combustion power and paved highways could be fully realized.

By contrast, the driverless car offers no such economic advantage to the individual driver, since he is already donating his own labor to operate the vehicle. In implicit recognition of this fact, the claim is made that the most significant consequence of this invention will essentially be to reduce the cost of taxis to the point that renting a car on a trip-by-trip basis actually becomes cheaper, and no less convenient, than owning one. In other words, a driverless car network, for all the technology it requires, is really a simple labor saving device, which like the very early car, allows an existing function to be performed more cheaply but otherwise not much better: certainly driverless cars will not enjoy the kind of speed advantages over human-driven cars as the autos of the 1920s gained over horse-drawn carriages. In this sense, it is functionally equivalent to a massively subsidized (or, perhaps, completely unregulated) human-driven taxi service, which, in theory, could be funded for no more than the amounts currently spent on private car ownership, and certainly with less technological difficulty.*

As it happens, non-subsidized transit systems of this sort already exist, and have existed for decades, in many cities of the developing world where labor is cheap, car ownership is low and public transit options are limited.

Auto rickshaw in Bangalore and Xe Nom drivers in Hanoi. Wikipedia and Flickr/Gavin White
These transit systems, based first on human-powered rickshaws and later auto rickshaws, motorbikes and pedicabs, provide both point-to-point and last-mile transport, essentially substituting for private vehicle ownership.  However, the tendency over time, as a country grows wealthier, is not for auto rickshaws to become ubiquitous, but for public transit and private vehicles (motorbikes or cars) ownership to supplant them. This is certainly due in part to the rising cost of labor, but must also be due to the inherent comfort and convenience of owning one's own vehicle in low-density areas and of the geometric efficiencies of transit in a dense city (using Jarrett Walker's terminology). The dense city of taxi-based transport tends to be a traffic nightmare. The low-density city, on the other hand, generally uses taxis in a limited supportive role.

(An exception might be the dense but mid-sized city of the developing world, such as Jaen, in Peru, a country that is notorious for the use of largely unregulated, and therefore quite cheap, taxi and bus systems to supplement inadequate public mass transit systems, such as in the far larger capital of Lima):

Motorbike-taxis on the streets of Jaen, Peru. Exploration of the city on Streetview shows a
largely taxi-based transportation system, supplemented with private motorbikes. There are
only a handful of automobiles visible here and there, mostly utilitarian in nature. A far cry
from the SUVs of American streets, these vehicles actually seem designed around the
size and weight of human beings, and create a steady but by no means congested flow of traffic.
For driverless cars to reverse this durable observed trend, and actually encourage people to dispose of their cars, we'd need to believe that the cost savings of driverless taxis could outweigh the inevitably increased inconvenience of not having personal ownership (including ownership of a driverless car) for most or all people. The problem with this scenario, though, seems to be twofold, as stated before:
  • In dense urban areas, very cheap and convenient taxi service may overwhelm highways and city streets, as it does in Hanoi or Mumbai or many other cities of the developing world, negating that same convenience and worsening the quality of urban life (miles driven are expected to increase with a "robotaxi" system, according to one recent study, and this may underestimate the number of transit riders, cyclists and pedestrians who switch to driverless taxis). If the number of taxis is limited, as in most cities in developed countries today, then this will partially negate the cost advantage of lacking a human driver and will certainly hinder convenience, illustrating again that this is as much an issue of restrictive licensing and geometry as it is technology. Arguments on behalf of robotaxis appear to assume that their numbers will not be limited by law.
  • In suburban and rural areas, sufficiently frequent robotaxi service may be difficult to provide, yet the cost of storing one's own personal vehicle will continue to be minimal or nonexistent while providing total convenience. Additionally, suburban errands often require multiple stops spread out over a large area due to car-based urban design, which will either require tiresome and inconvenient re-hiring of cars for each leg and practical difficulties with transferring purchased goods, or else cars will need to 1) park at each destination or 2) cruise around aimlessly while waiting, either of which would lessen certain of the the advantages over individually owned vehicles. 
There is one other issue which I raise by way of a insightful quote from Neil Salmond's article on robotaxis: "Once you own a car - and so mentally discount the cost of insuring, maintaining, fuelling the car - then every trip looks free." Although I agree with this, it also suggests a very difficult path toward weaning people off private car ownership. A privately-owned car is immensely versatile. It can handle short trips, medium-length trips and cross-country treks. It is always there and ready to go at a moment's notice, at times of high and low demand alike, with no questions asked. For many it is a personalized space as much as one's own bedroom or office, and doubles as a mobile storage unit. The opportunity cost of giving up all this "free" travel, and its associated comforts and conveniences, may therefore be much higher than might be suggested by a pure dollar-and-cents comparison.  Further, once the car is owned, whether it be human-driven or not, the incentive to use a taxi system at all is much reduced for the very reason Neil describes. No matter how reasonable a robotaxi trip might be, it cannot beat the perception of "free."
Whether or not robotaxis can succeed at large scale in American cities, there are a few areas where a privately-owned driverless car could provide an unmitigated social and economic good. For those unable to drive and without access to reliable transportation, such as young people or very elderly living in car-dependent areas, owning such a car could be a lifeline to mobility and independence. That would have the potential to remedy one of the greatest inequities of a car-based transportation system (though certainly not the only one). It's also tempting to imagine, as Neil suggests, driverless cars ferrying commuters to rail stations, and thereby opening commuter parking lots for redevelopment, and it's certainly possible, or even likely, that driverless cars could become the default ownership option. A cheaper, but non-revolutionary, taxi system might not be such a bad thing, especially for households that need access to a car but only rarely. And what of the implications of driverless buses, and driverless car sharing? As an incremental step that expands transportation options while lowering costs, it has promise.

The vision of a fleet of driverless taxis completely supplanting car ownership, however, seems to encounter significant practical difficulties. Many vehicles on the road must remain individually owned in any event (such as vehicles serving a particular business).  With the abundant free parking already prevalent in the United States, one of the greatest cost benefits of a taxi system — eliminating the need for costly local storage — is greatly lessened. In other countries or in certain US cities, this advantage might be more appreciable, but then, a city that is sufficiently dense will, or eventually will, offer alternative transportation options that do not require storage, either. In the case of this technology, only time will tell.

-----------------------------------------------------------------------------

*Let's consider that for a second. One study has estimated that a fleet of driverless taxis could dramatically reduce car ownership, on the order of one driverless taxi replacing eleven owned vehicles. Given car ownership in the US of 800/1,000 population, this suggests a reduction in car numbers to only 72/1,000, or approximately the same number seen on the roads of Mongolia.

Now, with the savings from not having 728 owned cars, at an average of $8,800 per year per car, a surplus of $6,400,000 per 1,000 population is generated, or approximately $90,000 per remaining car just based on eliminating ownership. Even if we generously assume $30,000 per year per car to account for gas, heavier maintenance and more frequent car replacement, that still leaves $60,000 for driver wages even before accounting for any per trip fees levied on riders. Even a modest fee of, say, $2 average per ride, could generate tens of thousands of additional dollars per year. In other words, replacing private car ownership looks, at least on a back-of-the-envelope calculation, like it would be financially feasible right now, not at some uncertain date in the future.

This still underestimates the savings, however, since by eliminating private car ownership, and turning the task of piloting cars over to professional drivers, we both eliminate the need for expensive parking minimums and may reduce the economic cost of crashes (estimated at $871 billion each year nationwide, or $900/person in economic losses).

Furthermore, such a network would presumably make many local bus systems obsolete or uneconomic (though probably not regional bus or rail systems), so that spending in these areas could be transferred to supporting a public network of taxis, offsetting the additional tax that would need to be levied to fund the system. Although the retention of human drivers creates a major added expense, drivers can be expected to perform some duties (refueling/recharging/basic cleaning and maintenance) that would otherwise need to be done by separate employees, and the human brain offers a proven technological fix to many of the difficulties still encountered by driverless cars.

Sunday, February 17, 2013

Was the Rise of Car Ownership Responsible for the Midcentury Homeownership Boom in the US?

It's common to hear from certain quarters that not only did the advent of mass motoring in the mid-20th century lead to a change in the types of homes Americans lived in, but that it brought about increased rates of homeownership as well.  This increase is typically presented as being one of the major benefits of mass automobile ownership.  Randal O'Toole, writing in 2006, makes the claim more boldly than most:
"Homeownership rates have increased by nearly 50 percent, from less than 48 percent in 1930 to nearly 69 percent today. This was almost entirely due to the increased mobility that automobiles offered to blue collar workers."
The point is often grudgingly conceded by sprawl opponents, or else goes unmentioned (The Geography of Nowhere, for instance, does not mention homeownership rates once in its 275 pages, nor does Suburban Nation). If the mobility provided by the automobile did lead to high rates of land consumption for residential uses, at least in doing so it brought down the cost of land accessible to job centers, allowing city workers to enjoy property ownership where once they had been in thrall to urban landlords, right?

The picture, looked at a bit more closely, isn't quite so clear.  The 1890 Census, the first census in which questions about ownership and renting were asked, showed a homeownership rate of 47.8% (homeownership had apparently been declining since at least 1870, however).  In spite of the arrival of the affordable automobile in 1908, the rate continued to decline through 1920. By 1930, following 20 years of explosive growth in household car ownership, it had only regained its 1890 heights of 47.8%.  The first great wave of car-buying, representing one-half of the total increase in household car ownership down to the present day, was accompanied by very little change in the homeownership rate (note that the electric streetcar boom, starting in the late 1880s, was similarly not accompanied by a rise in homeownership).


Based on Census data and car registration statistics.

Although car ownership dipped in the early Depression years, a resurgence after 1933 drove it to new highs by 1940.  In spite of unprecedented government intervention to spur the housing market in the 1930s, however, including the arrival of revolutionary forms of mortgage financing, homeownership declined to 43.6% in 1940.

The most curious piece of the puzzle, however, is the period from 1940-1945. During those years, the homeownership rate increased by around 10 percentage points, representing almost 50 percent of the entire increase from 1940 to 2012.  The timing of this increase is oddly overlooked in much of the economics literature on American homeownership trends (O'Toole himself tells the audience in a CATO presentation from last year, at the 15:22 mark, that the increase in homeownership occurred "after World War Two").

It goes without saying that these were years of exceptionally low car use: although the absolute number of cars did drop substantially, gas rationing reduced automobile mobility to levels not seen since the mid-1920s, if not earlier.  This seemingly inexplicable rapid rise has not received much direct attention in the literature, but one 2012 paper finds that one probable explanation was the wartime imposition of rent controls, which "stimulat[ed] the withdrawal of structures from the rental market for sale to owner-occupiers at uncontrolled prices."

The study also contains an implied suggestion that, counterintuitively, it may have been the very reduction in wartime use and availability of cars that helped spur the ownership increase. Although the study notes that "due to restrictions on the purchase of many goods, much of consumers' income had no outlet other than savings" -- savings which were put toward down payments on homes -- one of the primary savings must have come from reduced spending on new automobiles and associated goods and services.

Of course, homeownership did continue to rise after 1945, but at a slower rate.  Notably, the price of homes did not decline during this period, as might be predicted by the automobile-based theory, but instead after a brief postwar dip continued to climb through the mid-1950s, according to Case-Shiller data.  Prices did begin a very gradual decline in the late 1950s, but by then the rise in homeownership was slowing, and increases after 1960 (at which time the interstate system was less than a quarter complete) were very modest. In fact, as of early 2012, the US homeownership rate was estimated to be close to that of 1965.

Case-Shiller home price data, adapted from original NYT graphic.

Rather than being a benefit of cars, the postwar portion of the increase is generally attributed to a combination of 1) the increasing prevalence of FHA and VA mortgages, which by the early 1950s were approaching 50% of the mortgage market, 2) rising real incomes; and 3) demographic changes.

Although some studies have estimated that increasing car ownership was responsible for as much as 60% of the form of the suburban growth that occurred after 1945, this is not to be confused with homeownership. After all, countries with large shares of multifamily housing, such as Spain and Italy, may have very high homeownership rates (78% for both), while Germany and Denmark, where densities are lower and single-family detached housing is more common, have very low rates (42% and 51%).  These differences appear to be due to government policy toward housing rather than to transportation mode (Spain and Denmark, for instance, have a nearly identical modal split). 

Now, I do think O'Toole ought to agree with at least some of this: he admits in his talk that varying homeownership rates from country to country are due to government policy (at 4:16), and has lately criticized smart growth policies for inflating prices (a topic I plan to get to in an upcoming post). If one's concern is not actually homeownership per se, but rather living in detached single-family residences on large lots (a favorite theme of Joel Kotkin), or perhaps if one believes that ownership of a single-family detached home is the only true form of ownership, then the car does take on greater significance. 

Tuesday, December 4, 2012

Do Cities Densify or Disperse as They Grow?

In a recent post, Chris Bradford has built on some of the findings I made on weighted density last month to show how housing affordability has relatively little relation to density.  In the graph below, I have a look at a related subject: the relation of total population to density, to determine whether cities tend to grow denser as they grow larger.  I use urbanized, rather than weighted density, since the purpose here is to determine the relative change in extent of the built-up area at various population levels, and plot it against MSAs ranked in order of population (not population itself). A trendline with period 20 is overlaid on the scatter plot.


As predicted by the correlation data from an earlier post, urbanized density is here shown to be significantly related to total population, yet the scatterplot teases out some intriguing nuances in the data.  For instance, urbanized density shows little change for MSAs up to a population of around 200,000 (around point 150 on the X axis).  A modest upward trend is visible for cities between 200,000 and 700,000, after which the line slopes sharply upward. How to explain these trends?

An economic model using a simplistic urban land value gradient (illustrated as the New Urbanist transect) would find the results entirely predictable: as a city grows in extent, the time value of a central location becomes increasingly large relative to the price value of a peripheral location, such that we'd expect to see a slowing in the rate of growth of the urbanized area over time as either 1) new residents locate in existing, centrally-located neighbourhoods, 2) new greenfield developments are built at higher densities or both.

Using averages of urbanized area density for each population level, it is possible to visualize this process in action.  At left, I show the travel time in minutes from fringe to center (assuming for simplicity's sake a perfectly circular and monocentric city with no topographical impediments, and using the mean US commuting speed of 32 mph) holding density constant at 2,000 people per square mile, which represents the average density for MSAs of below 400,000 inhabitants.* At right are the same figures using the densities that are actually observed for each of the population ranges.


For smaller cities, even significant increases in population do not cause travel distance to the center to increase to unpleasant levels (bearing in mind that the typical person wants to devote no more than one hour per day to commuting), so densities do not increase – in fact, for cities less than 150,000, growth appears to track with a slight decrease.  Significant increases in urbanized density kick in only when travel distance from fringe to center approaches 20 minutes, and rapidly increase thereafter in an apparent attempt to keep maximum one-way travel time close to 30 minutes.  Were larger cities comparable in density to smaller ones, one-way travel times from the urban edge could approach one hour for cities of around 5,000,000.

At this point, I might expect Wendell Cox to interject with his contrary finding that "the general tendency is for cities to become more dispersed (less dense) as they grow."  Cox's conclusion was drawn from a statistical study of urbanized area density for cities from each of the 1950 to 2010 censuses, in which he found that most have indeed become less dense over time even as their populations increased dramatically during this 60-year period.  How can this be reconciled with the figures above?

In a nutshell, because the 1950-2010 time period covers a transportation, zoning and family planning revolution that completely altered commuting patterns and household composition.  In 1950, the interstate highway system did not yet exist, and relatively little new housing had been built following the emergence of zoning in the late 1920s due to the Depression and the lean war years.  The combined effects of these two developments – speedy access to city hinterlands combined with rules that prevented intensification of and discouraged investment in existing neighborhoods – no doubt contributed to a massive decentralization that overrode the natural tendency for urbanized density to increase with growth.  Additionally, household size contracted as the birth rate declined, which would tend to cause a steady decline in population density even where the concentration of housing units remained constant.

In fact, examining the fastest growing cities during the period 1980-2010, after the completion of the bulk of the interstate highway system, there is clear evidence of a swing back toward higher urban densities, particularly in those places that had little pre-automobile urbanism to de-densify either through abandonment or gentrification. Las Vegas, for instance, which had a population of 25 at the dawn of the auto era, is almost twice as dense as it was in the 1980 census. In Phoenix, lot sizes for new single family detached homes declined steadily after peaking in the late 1970s, leading to an odd situation in which neighborhoods on the urban fringe are often denser than much more centrally located ones. Notable exceptions include Southeastern boomtowns like Atlanta and Charlotte which, however, saw their density declines slow or cease after 1980.**

These numbers help provide a partial explanation for the data in an earlier post, Commutes, Tradeoffs and the Limits of Urban Growth, where I noticed that mean commuting times did not increase in step with population growth, and provides further reassuring evidence that even automobile-based urban expansion (i.e. suburbanization) contains a natural braking mechanism that will eventually slow the rate at which new land is consumed for development.

*Of course the average travel distance to the center will be less for the MSA as a whole, and most new residents will not be commuting to the center at all, typically reducing their commuting times.  The model is a deliberate oversimplification intended to illustrate basic trends.

**Interestingly, both Atlanta and Charlotte pursued major mass transit projects around this time period (MARTA's heavy rail system and the LYNX light rail, respectively) while much denser Las Vegas did not.  One could speculate that car commutes in Las Vegas were much shorter due to its density-driven compact urban area, leading to less political pressure for alternative forms of transportation to serve suburban commuters (despite being considerably larger than Charlotte population-wise, Las Vegas currently occupies only 56% of its land area).  Perhaps coincidentally, Atlanta and Charlotte, of very similar densities, approved tax increases to fund rail service at around the same respective point in their population development Atlanta at 1.8 million, and Charlotte at 1.5 million.

Tuesday, July 24, 2012

Commutes, Tradeoffs and the Limits of Urban Growth

I've been looking through the mean commuting times recently released as part of the 2010 ACS estimates for metropolitan statistical areas.  Although a lot has been written about commutes recently, what I found most striking about the data was the similarity between mean commuting times among large metro areas, regardless of their population.  Below is a list of all American MSAs with more than two million residents for which mean commuting times were available through the ACS:

Although population is strongly correlated with commuting time, particularly when all metro areas over population one million are included in the sample, the differences are surprisingly small.  Orlando, with an urbanized area of only 600 square miles, has a mean commute just twelve seconds shorter than Dallas, which covers 1,780 square miles, although both cities have comparable densities, employment centralization and highway miles per capita.

The conventional explanation for this phenomenon, as one 1997 study puts it, is that "individuals and firms mutually co-locate in response to congestion costs, and thus reshape those costs."  Implicit in this "tradeoff" theory is that, for most people, commutes beyond a certain length of time are undesirable despite any other advantages that might be gained from the location (e.g. housing cost, school quality, taxation level, crime), or else we should see commute lengths increase at a faster rate relative to population.

The data suggests that maximum mean travel time is somewhere slightly over 30 minutes, as indicated by the outlier example of New York, where most residents of the metro area apparently prefer to pay very high prices for housing rather than relocate to far cheaper, but more distant locales (such as Dutchess County or the northern Philadelphia suburbs). The 30-minute figure has been noticed before by transportation planners.

What do these constraints suggest for the urban form of America's cities, if anything?  The map below shows the commute from a new residential development in Katy, Texas, to Houston's central business district, which is measured by Google maps at 44 minutes in optimal traffic conditions (Uptown Houston is only a slightly closer 39 minutes).  At distances like this, with a diminishing number of potential purchasers willing to undertake such long commutes to major job centers, faster transit virtually out of the question, and any new edge city employment clusters unlikely to contribute a significant proportion of metro area jobs, one wonders how much longer outward urban expansion can continue at its current rate.


If the theory that commuting time preferences are more or less universal is true, we should by now expect to see a considerable refocusing of residential development in and around Houston's employment centers (bearing in mind that less than 1 in 5 Houston commuters currently has a commute of 45 minutes or more, although it's unclear how many of these are "super-commuters" those who travel to the city once or twice per week and return on weekends of which Houston has a nation-leading proportion according to one study).  As Chris Bradford reported back in March, this is precisely what is happening.  Thousands of new units are under construction in core neighborhoods, yet demand is so high that prices are soaring anyways. The study quoted earlier puts it succinctly:
"[A]t the metropolitan level, average density is principally a surrogate for city size. ... Thus densification, like polycentricity, is primarily a market response to contain or reduce otherwise high interaction costs found as cities increase in population ... rather than a cause of those travel times."
This theory doesn't imply that outwards expansion will come to a screeching halt once some magical distance from the center is reached, but that the balance of new construction will attempt to shift to the core as commutes from fringe areas begin to significantly exceed 30 minutes. For those despairing of an end to suburban sprawl, this may provide a glimmer of hope.  However, smaller cities with abundant land for expansion for instance, Indianapolis, San Antonio or Oklahama City ought to see comparatively less movement back toward the center, and that is reflected in the 2010 Census data (exceptions will certainly exist, though, due to other factors such as geography, demographics, transportation investments and city regulations).

None of this is exactly earth-shattering stuff, but in terms of looking at big picture issues for long-term urban growth, the importance of time preferences shouldn't be overlooked.

Other reading:
--Old but still relevant: Housing and the Journey to Work in U.S. Cities (Observing that the shift to auto commuting was a rational choice during the 1960-1990 period, and accounted for declines in average commuting times in spite of increasing commuting distances.  However, as of 2010, average commutes are up in all major cities as compared to 1990, in many cases significantly, showing the diminishing returns of this strategy over time).
--Basics on housing patterns and highway building: Suburbanization and Transportation in the Monocentric Model
--More spatial patterns: Traffic and Sprawl: When Jobs Suburbanize, Whither the Commute? (Echoing the finding that job decentralization is associated with shorter commutes, but observing that it cannot halt or reverse the trend of increasing average commutes as due to overall urban growth).

Monday, May 28, 2012

Transit Types and Modal Share: More Numbers

I've put together three additional charts, correlating per capita highways, heavy rail and light rail with commuting transit share for an expanded list of thirty American cities, in the hope that these statistics might add to and shed light on the results from the previous post.  Although the first two charts are probably in line with most expectations, the third, for light rail, may come as somewhat of a surprise.

First, here are highway lane miles per capita plotted against commuting transit modal share, using highway and population data from the Federal Highway Administration (h/t Walkable DFW):

As might be expected, there is a correlation between decreasing freeway lane miles and increasing transit modal share, but it is not strong.  Eliminate the three outliers of Kansas City, St. Louis and New York, and even that modest correlation is cut in half.

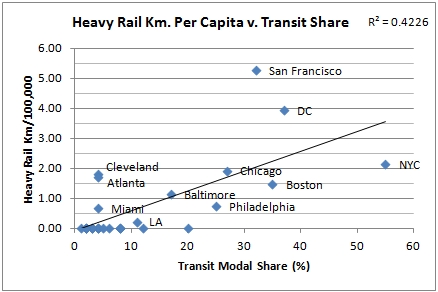
By contrast, the correlation between transit share and kilometers of heavy rail is much more robust.  For this chart, only urban heavy rail systems, such as subways, were included. Regional commuter rail, such as New York's Long Island Railroad or San Diego's Coaster line, is excluded to keep the comparison consistent:


Eliminating the cities with no heavy rail from the sample reduces the correlation to an R2 value of .17.

Last, and perhaps most surprising, are the light rail numbers.  Regardless of whether cities with no light rail are included, there is a statistically insignificant (but consistently negative) correlation between light rail kilometers per capita and transit share.  The United States seems to be flush with cities with substantial light rail networks and low transit modal share.  The exceptions are the cities which also have heavy rail networks (SF, Philadelphia and Boston).  Three other heavy hitters have no light rail, although all had systems in the past (NYC, DC and Chicago):


Two cities with no or essentially no light rail at all, Milwaukee and Detroit, surpass numerous other cities with extensive networks.  Portland's extensive system, more than five times larger than Seattle's on a per capita basis, has only earned it 60 percent of that city's modal share (arguably, Seattle should be given an even lower value on this chart, as the King County branch of its light rail system opened more than halfway through 2009, the year measured by the ACS in computing modal share data).

Are there any further points to glean here?  Certainly no correlation shown here approaches the correlation of urban population density to modal share that I provided in the previous post, which remains by far the strongest correlate of transit use. The role of bus networks is obviously huge, but I wasn't able to find a single metric useful in making cross comparisons that was available for all bus operators (routes per capita is a possibility, but there is no way of knowing the length of these routes in most cases.  I might add it in later anyways, if I can locate the data for it). Commuter rail would introduce more complexities.

Chart data are below.  Numbers in the last three columns show miles and kilometers per capita (per 1,000 or 100,000).  Note that modal share data are for cities, rather than the greater urban areas from which population figures used to compute per capita highway and rail figures are drawn, but are more closely tied to the types of urban transit systems I have included.  You are welcome to reuse this information, but no guarantee of accuracy is offered.  Contact me if you'd like the excel file.

Sources:
DOT: Highway Statistics 2007
2009 ACS via The Transport Politic
Wikipedia (for light and heavy rail statistics)

Related posts: 
Chris Bradford: The association between density and mode of commute. Chris finds that standard density is weakly predictive of transit modal share, but weighted, or perceived, density is strongly correlated with it.
Laurence Aurbach: Fun with Density and Transit Statistics.