Sunday, February 17, 2013

Was the Rise of Car Ownership Responsible for the Midcentury Homeownership Boom in the US?

It's common to hear from certain quarters that not only did the advent of mass motoring in the mid-20th century lead to a change in the types of homes Americans lived in, but that it brought about increased rates of homeownership as well.  This increase is typically presented as being one of the major benefits of mass automobile ownership.  Randal O'Toole, writing in 2006, makes the claim more boldly than most:
"Homeownership rates have increased by nearly 50 percent, from less than 48 percent in 1930 to nearly 69 percent today. This was almost entirely due to the increased mobility that automobiles offered to blue collar workers."
The point is often grudgingly conceded by sprawl opponents, or else goes unmentioned (The Geography of Nowhere, for instance, does not mention homeownership rates once in its 275 pages, nor does Suburban Nation). If the mobility provided by the automobile did lead to high rates of land consumption for residential uses, at least in doing so it brought down the cost of land accessible to job centers, allowing city workers to enjoy property ownership where once they had been in thrall to urban landlords, right?

The picture, looked at a bit more closely, isn't quite so clear.  The 1890 Census, the first census in which questions about ownership and renting were asked, showed a homeownership rate of 47.8% (homeownership had apparently been declining since at least 1870, however).  In spite of the arrival of the affordable automobile in 1908, the rate continued to decline through 1920. By 1930, following 20 years of explosive growth in household car ownership, it had only regained its 1890 heights of 47.8%.  The first great wave of car-buying, representing one-half of the total increase in household car ownership down to the present day, was accompanied by very little change in the homeownership rate (note that the electric streetcar boom, starting in the late 1880s, was similarly not accompanied by a rise in homeownership).


Based on Census data and car registration statistics.

Although car ownership dipped in the early Depression years, a resurgence after 1933 drove it to new highs by 1940.  In spite of unprecedented government intervention to spur the housing market in the 1930s, however, including the arrival of revolutionary forms of mortgage financing, homeownership declined to 43.6% in 1940.

The most curious piece of the puzzle, however, is the period from 1940-1945. During those years, the homeownership rate increased by around 10 percentage points, representing almost 50 percent of the entire increase from 1940 to 2012.  The timing of this increase is oddly overlooked in much of the economics literature on American homeownership trends (O'Toole himself tells the audience in a CATO presentation from last year, at the 15:22 mark, that the increase in homeownership occurred "after World War Two").

It goes without saying that these were years of exceptionally low car use: although the absolute number of cars did drop substantially, gas rationing reduced automobile mobility to levels not seen since the mid-1920s, if not earlier.  This seemingly inexplicable rapid rise has not received much direct attention in the literature, but one 2012 paper finds that one probable explanation was the wartime imposition of rent controls, which "stimulat[ed] the withdrawal of structures from the rental market for sale to owner-occupiers at uncontrolled prices."

The study also contains an implied suggestion that, counterintuitively, it may have been the very reduction in wartime use and availability of cars that helped spur the ownership increase. Although the study notes that "due to restrictions on the purchase of many goods, much of consumers' income had no outlet other than savings" -- savings which were put toward down payments on homes -- one of the primary savings must have come from reduced spending on new automobiles and associated goods and services.

Of course, homeownership did continue to rise after 1945, but at a slower rate.  Notably, the price of homes did not decline during this period, as might be predicted by the automobile-based theory, but instead after a brief postwar dip continued to climb through the mid-1950s, according to Case-Shiller data.  Prices did begin a very gradual decline in the late 1950s, but by then the rise in homeownership was slowing, and increases after 1960 (at which time the interstate system was less than a quarter complete) were very modest. In fact, as of early 2012, the US homeownership rate was estimated to be close to that of 1965.

Case-Shiller home price data, adapted from original NYT graphic.

Rather than being a benefit of cars, the postwar portion of the increase is generally attributed to a combination of 1) the increasing prevalence of FHA and VA mortgages, which by the early 1950s were approaching 50% of the mortgage market, 2) rising real incomes; and 3) demographic changes.

Although some studies have estimated that increasing car ownership was responsible for as much as 60% of the form of the suburban growth that occurred after 1945, this is not to be confused with homeownership. After all, countries with large shares of multifamily housing, such as Spain and Italy, may have very high homeownership rates (78% for both), while Germany and Denmark, where densities are lower and single-family detached housing is more common, have very low rates (42% and 51%).  These differences appear to be due to government policy toward housing rather than to transportation mode (Spain and Denmark, for instance, have a nearly identical modal split). 

Now, I do think O'Toole ought to agree with at least some of this: he admits in his talk that varying homeownership rates from country to country are due to government policy (at 4:16), and has lately criticized smart growth policies for inflating prices (a topic I plan to get to in an upcoming post). If one's concern is not actually homeownership per se, but rather living in detached single-family residences on large lots (a favorite theme of Joel Kotkin), or perhaps if one believes that ownership of a single-family detached home is the only true form of ownership, then the car does take on greater significance. 

Friday, February 8, 2013

More Townhouse Parking Approaches, From the Comments

I'm fortunate on this blog to have commenters who not only are willing to share their wealth of knowledge on the topics I post about, but who frequently include links to streetview images of their own choosing which, due to the limitations of Blogger's commenting system, can't be easily displayed there.  Many of these examples are so interesting and relevant that I often want to feature them in a post of their own. I've finally gotten around to doing that here, using some of the examples submitted in response to last Friday's post on townhouses and parking (I may add to this list as time allows).

Nicolas Derome, who has a series of posts at the Strong Towns Network exploring the urban form of Toronto and Montreal that I recommend checking out, contributed examples of contemporary attempts to integrate townhouses and parking from both of those cities:


Nicolas notes that in the above Toronto example, since the streets are private, widths of only 20 feet, rather than 25 or 30 feet, are permitted.  The technique of recessing garage doors while emphasizing pedestrian entrances is presumably intended to mitigate the visual effect of the garages: is it an improvement?


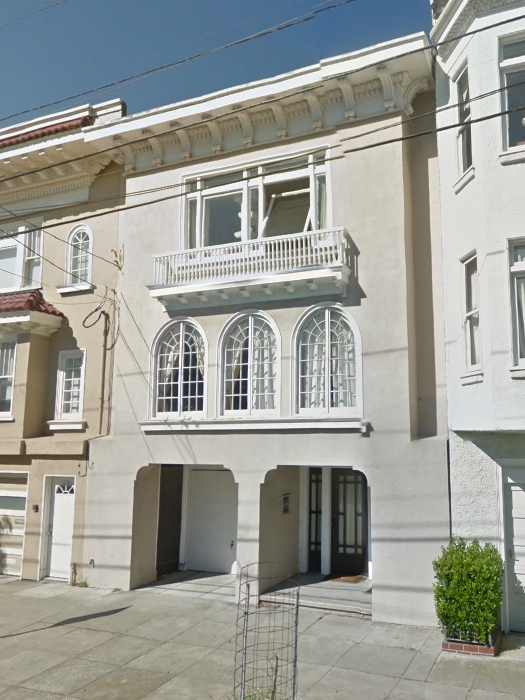
From Alai comes this example of parking subtly integrated into Craftsman-style San Francisco rowhouses.  I agree with Alai that this is a better result than the example I showed from the Sunset neighborhood, and in fact many San Francisco townhouses of the first half of the 20th century did make creative efforts to incorporate garages elegantly and unobtrusively:


Another example from Nicolas shows a parking approach taken in Montreal, where a narrow driveway is used to access below grade parking, which is then decked over to provide a spacious patio area.  This is very similar to one of the townhouse parking approaches described by Nathan Lewis (see Solution Three), and requires no more than the excavation of a basement-sized area:


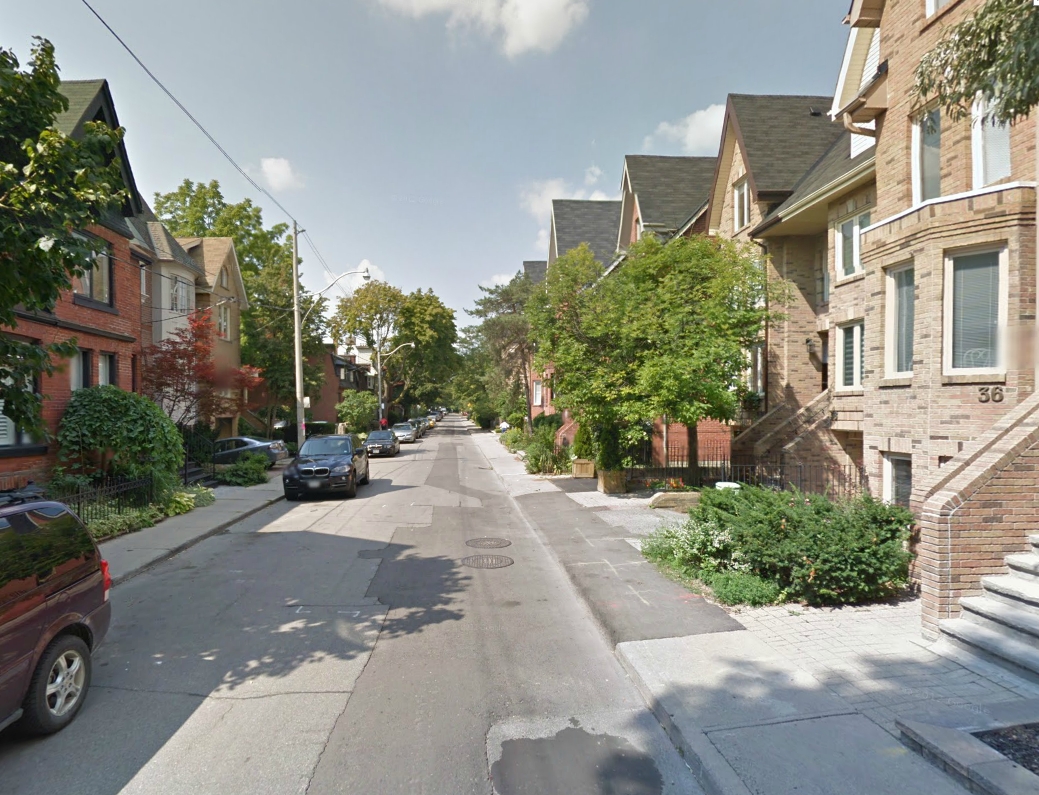
Finally, another example from Nicolas featuring Alcorn Avenue, not far from Toronto's central business district.  The street appears to have a mix of rowhouses from throughout the 20th century, including several from the 1980s with front-loading parking.  The overall result is very successful though, due in part to the narrowness of the street, in part to the effective use of limited greenery, but more than anything to what Marc describes in the comments as "organic variation - [where] each house and door [is] designed by a different person." This variation, Marc notes, communicates a human presence even where garages are present and noticeable.

This sort of variation was also cited as a sign of urban health by Jane Jacobs, of course, whose own home was located within walking distance of Alcorn Street.  As she wrote, "a successful city district becomes a kind of ever-normal granary as far as construction is concerned. Some of the old buildings, year by year, are replaced by new ones or rehabilitated to a degree equivalent to replacement. Over the years there is, therefore, constantly a mixture of buildings of many ages and types." When redeveloped piecemeal, rather than at once, each new building adds to the texture of the street, and the whole becomes more than the sum of its parts.


Thanks again, everyone, for all the interesting comments.

Friday, February 1, 2013

Can Townhouses and Front-loading Garages Work Together?

The Philadelphia Real Estate blog recently ran a post on local opposition to a very modest rowhouse infill project in the city's East Kensington neighborhood.  Driving the objections of nearby residents are three planned garages that open onto the street, which occupy approximately half of each of the three façades, and which are apparently prohibited under the city's new zoning code.

Do front-loading garages truly present an insoluble design problem for the rowhouse format?  A quote from Andres Duany and Elizabeth Plater-Zyberk's The Second Coming of the American Small Town illustrates this common point of view in arguing for the reintroduction of rear service alleys:
"When housing achieves a certain density but parking remains a necessity, the car's house (the garage) overwhelms the human's house. No architect is skillful enough to make human life project itself on the façade of a house when 60 percent of it is given over to garage doors."
Taking the 60 percent figure as a rule of thumb, we'll then say that no more than 50 percent of a façade can be occupied by a garage door before the aesthetics become intolerable (this is debatable, and I'd wager it's not what Duany and Plater-Zyberk meant to imply, but it sounds like a more or less reasonable estimate).  Using this figure, we get:
  • For single-car garage rowhouses, a width of no less than 16'.
  • For two-car garage homes, a width of no less than 32'.
Now, 16 feet is an extremely common width for rowhouses in the older neighborhoods of Philadelphia, Baltimore and Washington, D.C., but contemporary attempts to integrate standard 8' garages on these lots usually have not, in my opinion, succeeded in making "human life project itself" on rowhouse façades, nor do they provide much in the way of eyes on the street. I'm not convinced that it can't be done, but successful examples seem to be the exception rather than the rule

Contemporary rowhouses, South 19th St., Philadelphia.
What if we were to widen the lot a bit more?  These early 20th century rowhomes in the Sunset neighborhood in San Francisco, at 25 feet across, lessen the visual impact of the garage doors, although the street level experience is not much improved:

18th Ave., San Francisco.
Once we take a look at models beyond the United States, however, we see that far better street level results can be achieved using the same dimensions.  These Mexico City homes, at around 25 feet wide, present a friendlier face to the street.  The garage door itself, stylistically integrated with the window bars and iron balcony railing, is relatively inconspicuous. Success is dependent on there being a single-car garage only, although use of a two-car garage can be difficult to resist when the space is available. 

Colonia Condesa, Mexico City

Lengthening the frontages of rowhouses in order to admit more light and increase privacy was one of the many urban "patterns" set out by Christopher Alexander in A Pattern Language (available online here).  The primary anticipated objection to this change that it would decrease the density of new developments by reducing the number of rowhouses that could be accommodated on a single street he addressed by introducing a seven-foot pedestrian-only right-of-way between homes, which would, at intervals of every six to eight houses or so, intersect with wider automobile roads running perpendicular to the rowhouses. (Alexander advocated separate networks of auto and pedestrian streets in most cases, although not necessarily requiring each lot to have access to both, and proposed shared space streets on low-traffic routes).

Under Alexander's plan, rowhouses would not have garages, but instead any cars would be stored in small parking lots or garages along the automobile roads.  With 1000 sq. ft. rowhouses 30' wide on lots of 30' x 35', Alexander estimated a density of at least 30 units per acre, a figure which stands up to scrutiny.

This compares to the above examples as follows (using for reference a typical block, with fronting streets included):


Under the assumption that dense rowhouse streets will be low-traffic, we could instead adopt the Mexico City format, but with narrow, shared space streets with no sidewalks, and garages opening onto them directly.  On-street parking would be prohibited, although temporary access for drop-offs would remain possible.  Using lots of 25' x 35', it would again be possible to achieve around 30 units per acre. An additional benefit of the wider lots is that they seem to be more conducive to redevelopment as small apartments (visible in the Mexico City neighborhood).

Although examples of this precise format are very rare or perhaps nonexistent in the United States, California does have a number of places that come close, such as Manhattan Beach (note the unpleasant street-level effect of two-car garages, though).  Newer developments have begun incorporating shared space, narrow streets even closer to the model suggested here.  The bottom line, though, is that front-loading parking, even in high-density attached housing formats, need not be an aesthetic disaster, or without a watchful street presence.

Related reading:
  • Nathan Lewis' definitive take on the subject, "Townhouses with Parking," is available here.
  • To get your Philadelphia rowhouse fix, Townhouse Center covers an architectural review of 26 new rowhouse designs in that city, some which appear to integrate parking quite well within the context of 16-foot wide lots.
  • A photo collection of very narrow houses, including an image of Tokyo homes with front-loading garages on 10-foot lots.

Tuesday, December 4, 2012

Do Cities Densify or Disperse as They Grow?

In a recent post, Chris Bradford has built on some of the findings I made on weighted density last month to show how housing affordability has relatively little relation to density.  In the graph below, I have a look at a related subject: the relation of total population to density, to determine whether cities tend to grow denser as they grow larger.  I use urbanized, rather than weighted density, since the purpose here is to determine the relative change in extent of the built-up area at various population levels, and plot it against MSAs ranked in order of population (not population itself). A trendline with period 20 is overlaid on the scatter plot.


As predicted by the correlation data from an earlier post, urbanized density is here shown to be significantly related to total population, yet the scatterplot teases out some intriguing nuances in the data.  For instance, urbanized density shows little change for MSAs up to a population of around 200,000 (around point 150 on the X axis).  A modest upward trend is visible for cities between 200,000 and 700,000, after which the line slopes sharply upward. How to explain these trends?

An economic model using a simplistic urban land value gradient (illustrated as the New Urbanist transect) would find the results entirely predictable: as a city grows in extent, the time value of a central location becomes increasingly large relative to the price value of a peripheral location, such that we'd expect to see a slowing in the rate of growth of the urbanized area over time as either 1) new residents locate in existing, centrally-located neighbourhoods, 2) new greenfield developments are built at higher densities or both.

Using averages of urbanized area density for each population level, it is possible to visualize this process in action.  At left, I show the travel time in minutes from fringe to center (assuming for simplicity's sake a perfectly circular and monocentric city with no topographical impediments, and using the mean US commuting speed of 32 mph) holding density constant at 2,000 people per square mile, which represents the average density for MSAs of below 400,000 inhabitants.* At right are the same figures using the densities that are actually observed for each of the population ranges.


For smaller cities, even significant increases in population do not cause travel distance to the center to increase to unpleasant levels (bearing in mind that the typical person wants to devote no more than one hour per day to commuting), so densities do not increase – in fact, for cities less than 150,000, growth appears to track with a slight decrease.  Significant increases in urbanized density kick in only when travel distance from fringe to center approaches 20 minutes, and rapidly increase thereafter in an apparent attempt to keep maximum one-way travel time close to 30 minutes.  Were larger cities comparable in density to smaller ones, one-way travel times from the urban edge could approach one hour for cities of around 5,000,000.

At this point, I might expect Wendell Cox to interject with his contrary finding that "the general tendency is for cities to become more dispersed (less dense) as they grow."  Cox's conclusion was drawn from a statistical study of urbanized area density for cities from each of the 1950 to 2010 censuses, in which he found that most have indeed become less dense over time even as their populations increased dramatically during this 60-year period.  How can this be reconciled with the figures above?

In a nutshell, because the 1950-2010 time period covers a transportation, zoning and family planning revolution that completely altered commuting patterns and household composition.  In 1950, the interstate highway system did not yet exist, and relatively little new housing had been built following the emergence of zoning in the late 1920s due to the Depression and the lean war years.  The combined effects of these two developments – speedy access to city hinterlands combined with rules that prevented intensification of and discouraged investment in existing neighborhoods – no doubt contributed to a massive decentralization that overrode the natural tendency for urbanized density to increase with growth.  Additionally, household size contracted as the birth rate declined, which would tend to cause a steady decline in population density even where the concentration of housing units remained constant.

In fact, examining the fastest growing cities during the period 1980-2010, after the completion of the bulk of the interstate highway system, there is clear evidence of a swing back toward higher urban densities, particularly in those places that had little pre-automobile urbanism to de-densify either through abandonment or gentrification. Las Vegas, for instance, which had a population of 25 at the dawn of the auto era, is almost twice as dense as it was in the 1980 census. In Phoenix, lot sizes for new single family detached homes declined steadily after peaking in the late 1970s, leading to an odd situation in which neighborhoods on the urban fringe are often denser than much more centrally located ones. Notable exceptions include Southeastern boomtowns like Atlanta and Charlotte which, however, saw their density declines slow or cease after 1980.**

These numbers help provide a partial explanation for the data in an earlier post, Commutes, Tradeoffs and the Limits of Urban Growth, where I noticed that mean commuting times did not increase in step with population growth, and provides further reassuring evidence that even automobile-based urban expansion (i.e. suburbanization) contains a natural braking mechanism that will eventually slow the rate at which new land is consumed for development.

*Of course the average travel distance to the center will be less for the MSA as a whole, and most new residents will not be commuting to the center at all, typically reducing their commuting times.  The model is a deliberate oversimplification intended to illustrate basic trends.

**Interestingly, both Atlanta and Charlotte pursued major mass transit projects around this time period (MARTA's heavy rail system and the LYNX light rail, respectively) while much denser Las Vegas did not.  One could speculate that car commutes in Las Vegas were much shorter due to its density-driven compact urban area, leading to less political pressure for alternative forms of transportation to serve suburban commuters (despite being considerably larger than Charlotte population-wise, Las Vegas currently occupies only 56% of its land area).  Perhaps coincidentally, Atlanta and Charlotte, of very similar densities, approved tax increases to fund rail service at around the same respective point in their population development Atlanta at 1.8 million, and Charlotte at 1.5 million.

Friday, November 30, 2012

Yet Another Height Act Article


Washington's Height of Buildings Act has been a subject of debate for years now, but lately, with the Act under Congressional scrutiny, the discussion has taken on more than academic significance.  I'm wary of touching the subject at all, since it seems to have become more ideologically polarized than almost any other planning-related topic, generating ample heat but less light (one recent article refers to economists responding to its mere mention with "paroxysms of outrage").  Points of view ostensibly grounded in economics and statistics are supported with flip references to generalized principles, comparative urban study is given short shrift where it is not ignored entirely, and each side accuses the other of using economics as thin cover for aesthetic preferences, whether it be the free marketeer's skyscraper envy or the traditionalist's veneration of the mid-rise city.

A thoughtful article by David Alpert in Greater Greater Washington has triggered a vigorous debate, with Kaid Benfield mustering all available arguments in the Act's defense, and Alex Block and George Mason law professor David Schleicher on hand with rebuttals. Graciously citing an earlier post of mine, transportation planner Dan Malouff has issued a rebuttal to the rebuttals, taking a much-needed big picture look both chronologically and geographically, and touting the benefits of the Act for good urbanism. 

Without venturing into the aesthetic and form-based arguments, which have been covered exhaustively elsewhere, the hard numbers and economic arguments that have been submitted in opposition to the Act are relatively scarce.  I'll attempt to address a couple of them.

This recurrent complaint of high office rents raised by the free market side has made its most recent appearance in Schleicher's article, where he mentions that "[o]ffice space in downtown D.C. is more expensive than in New York's financial district, and 850 square-foot apartments in Anacostia, one of the cheapest areas in the city, now rent for $1300 a month" (yet citing to an article which states that in 2010, DC office rents were higher – barely – than those of New York City, not the financial district).  In response I would note:
  • The number appears to be cherry-picked. The same article cited by Schleicher indicates that rents had been much higher in New York during the preceding five years, and a more recent study of Class A office space in the DC and NY metropolitan markets shows DC rents at only 78% of the level of New York.  The 2010 market figure, taken near the bottom of the real estate market, does not appear to be representative of long-term averages, nor is it entirely clear what the geographic unit for comparison was (comparing DC proper to NYC would tend to inflate DC rents relative to NY rents, for instance, as DC is a much smaller fraction of its greater metro area).
  • Taking into account median incomes, both DC's office rents and residential rents seem cheap compared to NYC, with office rents the cheaper of the two. In recent years, the DC metro area has had the highest median household and individual income in the country, considerably higher than New York.  Based on this figure, we should expect to see very high housing costs (and probably also office rents) in the DC region, as income and housing costs are highly correlated throughout the United States, and DC moreover has other unique office demand factors related to the presence of the federal government. Washington does in fact have the second-highest MSA housing costs east of California, yet these are still cheaper than New York's, with the result that DC is in housing-to-income terms far more "affordable" than New York.  And yet office rents appear to be cheaper still: DC's housing cost averages 89% of that in New York, while its office rents, averaged over the past several years, seem to be in the range of 70-80% of New York's.  This is the opposite of what one would expect based on the views of the Height Act opponents, whose argument supposes that the Act primarily impedes construction of high-rise office space in the central business district.

Apart from a citation to a number from an Ed Glaeser study, which was partly debunked as regards its application to the Height Act in another Atlantic Cities article, there are no other figures presented in Schleicher's article.  Schleicher does cite, as is common in this debate, to general supply and demand principles, but Malouff counters him, noting that:


"There is currently around 100 million square feet of office space in downtown DC, which makes it the 3rd largest downtown in America after New York and Chicago. Despite no skyscrapers, downtown DC currently has a greater supply of office space than downtown San Francisco, Boston, Philadelphia, or Los Angeles."

So, broadly speaking, we do have a result that complies with supply and demand principles: DC has a larger supply of office space than comparable cities, and has office rents relatively lower than we would expect based on median incomes and other comparative measures.

I would add that, according to a 2006 Demographia survey, Washington's CBD is consistently found to be larger and denser than those of its peers.  For instance, DC's CBD is 1.5 times larger and has 1.7 times the employment density of Houston's. Similarly, it is both 1.3 times larger and denser than Philadelphia's CBD.  In both cases, it achieves this despite having less buildable area to work with, due to DC's exceptionally wide streets and generous allotment of parks.  It is also much more centralized, containing 18.7% percent of metro employment compared to Houston's 8.9%.  Given all this, can we at least allow for the possibility that the Height Act has actually stimulated, rather than impeded, growth and intensification of the downtown business district?  This would of course have implications for the usefulness of height limits to other cities and in other contexts, but it's a topic that deserves greater study.

Whatever the true answer might be in this case, more empirical evidence would be helpful in figuring out  answers to the economic questions at issue here.  Throwing around terms like supply and demand, however, without bothering to investigate what the “supply” is the in the first place, does not greatly contribute to the discussion.  One hopes that the forthcoming Congressional study is up to that task, but with the little evidence-gathering that has been done so far seeming to have been in the service of pre-determined conclusions, I am keeping my expectations low.

Friday, November 16, 2012

Exploring Weighted Density

Chris Bradford has recently run an excellent series of posts featuring the Census Bureau's newly-released data covering population-weighted density.  Chris has been an advocate of this density measure (also referred to as "perceived" density) for much longer, though, and has promoted it as a more useful alternative to both standard density and the somewhat more helpful urbanized area density.

At The Atlantic Cities, Richard Florida picked up on the story, noting its significance of these new figures in exploring the relationship between density and productivity.  The topic has been addressed at least once before: a 2010 report from the Federal Reserve Bank of New York, updated last year, used weighted population density to find that:
  • In general, productivity increases by 2 to 4 percent as weighted density doubles.
  • Productivity increases are correlated with human capital (e.g. skills and education), such that cities with a human capital one standard deviation below the mean have no productivity gains from increased density, while those with high human capital have twice the average gain.
  • The benefits of density are especially pronounced for certain industries, including professional services, arts, entertainment, information and finance.
Along the same lines, I've drawn up a correlation chart showing the population-weighted density for all metropolitan statistical areas as compared to several other factors, including total metro area population, population change during 2000-2010 both in net and as a percentage, urbanized area density, median home values, median personal income (a stand-in for productivity in many studies), and finally income-to-home value ratio (an indicator of relative housing affordability).  Each factor has been compared against every other (raw data is available here).


A few of the things that jumped out at me from the chart:
  • Income is more strongly correlated with weighted density than total population, although not dramatically so. However, median home values were even more strongly correlated with weighted density.  The result is that, for cities of equivalent size, the city with the higher weighted density will generally be less affordable in relative terms, even if incomes are higher (for instance, Sacramento is almost twice as dense as similarly-sized and lower-income Kansas City, but is only two-thirds as affordable).
  • Although high weighted-density metros have generally higher incomes than low-density cities, they grew more slowly than these cities, perhaps indicating the push and pull forces of housing affordability.
  • Nonetheless, relative housing value was negatively correlated with population growth, although not strongly.  This suggests a tension between low housing values being a product of low demand, and the attraction of low housing costs in otherwise prosperous cities that have presumably kept prices low through adequate supply.  Looking at only large cities bears this out (see below).
Here is the same chart showing only MSAs with more than one million inhabitants as of the 2010 Census:


The sign for affordability relative to population gain has flipped, and more affordable markets are here associated with higher population growth. 

Another factor I would have liked to include, had it been available for all MSAs, would have been median transportation cost, since to some extent that would offset the poor affordability of certain high-density cities.

I am skeptical, though, that these figures would make much difference for most cities.  Although recent studies have pointed to the transit savings of living in high density areas well-served by mass transit, most American metro areas remain overwhelmingly car dependent. Moreover, while high housing costs cannot be easily avoided, households have more direct control over transportation spending even in low-density cities. 

Beyond these points, I'll leave the numbers out there to speak for themselves.

Wednesday, September 12, 2012

Places That Aren't Car-free, But Should Be

The list of truly car-free urban settings in the world is surprisingly small, and for the United States, virtually non-existent outside of a few pedestrianized main streets. Tracy Gayton is leading a visionary effort to construct a completely car-free village in rural Maine according to traditional urbanist principles, in what would be the first such place of its kind in the United States, but I thought it might be worth pausing to consider what existing places would be best suited for a car-free retrofit.

In particular, I want to focus on those places in which the introduction or continuing presence of the automobile is seemingly irrational, yet the car appears in great numbers nonetheless. The incentives and motivations are simple: the first person to introduce a car to a given location obtains all the benefits of auto transport and suffers virtually none of the costs, which are instead imposed on others. Once a few cars are whizzing around, however, the collective advantage of a car-free city is lost, and a person who continues to refrain from purchasing a car only denies himself the benefits, as the costs have already been imposed on him by others.

Nathan Lewis talked about a similar phenomenon in the case of Juneau, the car-inaccessible Alaskan capital which has been built almost entirely around the needs of the automobile.  In the cases below, the towns and cities themselves are perfectly well-suited to pedestrian and/or bicycle transit, or nearly so, but have come to rely on motorized power to move human beings around anyways.  I'm sure readers can think of many others, but this is a start.

The City of Malé

Malé; the red line shows a 5-minute walk.
Malé, the capital city of the Maldives, accommodates over 100,000 inhabitants on a tiny island of just two square miles, roughly the same size as Barcelona's Gothic Quarter. Almost entirely covered with row houses and mid-rise apartment buildings along narrow streets, the island should be a pedestrian's paradise. It is ideal for bicycling, too, since the climate is balmy year-round and the island is flat.  The longest possible walk from one point to another on the island is just over 20 minutes, and the walk from the ferry to the center of town is less than 10. Commutes of longer than 5 minutes are impossible unless one deliberately forgoes a bicycle.  If that weren't enough, the island has a bus system as well.

In spite of this geography, photographic evidence shows the streets of the city utterly clogged with motorbikes, cars and trucks. One photo even shows a large commercial building with two floors devoted to a motorbike dealership. A recent article depicts the city government struggling to impose a driving ban on the single day of the Muslim holiday of Eid-al-Fitr, suggesting at least indirectly an awareness of the effects of mass motoring on this island.

The situation of the nearby island of Hulhumalé, built up through expensive and laborious land reclamation, is even less forgivable since it has been deliberately planned.  The home page of the island's development corporation shows that the primary development strategy  is the construction of numerous wide and unattractive asphalt streets, which are prominently featured in photos on the website. This is confirmed by looking at an aerial view. A purpose of these streets, according to the developers, is to "reduce congestion."  The types of transportation modes that might cause this "congestion" are not mentioned, although by the dimensions of the streets the planners are clearly anticipating cars, and lots of them.  This on a flat tropical island which takes three minutes to bike across!  There is also a rigid system of Euclidean zoning in the works, with the purely residential areas located on the opposite side of the island from the shopping areas, with large green spaces, an academy and governmental buildings serving as a buffer between them. Perhaps this was to encourage residents to purchase cars and motorbikes lest the streets go unused.

Nantucket

This choice is only natural, since the island of Nantucket was one of the last towns of any significance in the United States to retain a ban on cars, only relenting in 1918.  Although the island is far larger than Malé, population is concentrated in a single town approximately a mile by a mile and a half.  (A small settlement on the eastern end of the island was formerly served by a narrow gauge railway, and today has seasonal bus service.)  Similar to Malé, the terrain is largely flat and the weather is mild for much of the year.  Like a handful of other fishing and whaling villages of the Massachusetts shoreline, it lacks most of the telltale characteristics of the 19th century hypertrophic American city. Streets are narrow, a grid is absent, and setbacks are frequently small or non-existent. In form if not architecture it very much resembles Japanese urbanism, and is particularly well-suited for a pedestrian or bicycling culture. Most residents already get about by walking or on bike and the island has an extensive network of bike paths – why not take the next logical step and reclaim the island entirely for human beings?  (At right, Nantucket street vs. Tokyo street).

Santa Catalina Island

Although California's Santa Catalina Island does ban large vehicles, smaller cars and golf carts are permitted, and flood the streets of the tiny town of Avalon. Why this is necessary is not obvious.  From one end of the town to another is a five-minute walk and, according to Google maps, a two-minute bike ride.  The island also has a near-perfect climate with mild weather year-round and little rain in most months.  There are no other large settlements on the island. Where are all these people driving to?  (One could also ask: since the town was platted before the invention of the car, why were the streets designed to be 28 feet wide?)

Manhattan

This one is on a slightly larger scale. The idea of banning most, if not all, private cars from Manhattan is not new.  In 1961, the same year Jane Jacobs published The Death and Life of Great American Cities, writer Paul Goodman and his brother Percival authored an essay proposing to pedestrianize the majority of Manhattan's streets and avenues.  The crux of the Goodmans' argument was that private cars, in the manner in which they are currently used in Manhattan, "are simply not worth the nuisance they cause."  Ahead of their time, like Jacobs, the Goodmans also suggested a congestion charge to achieve some of the same benefits.

Whether one favors a bold approach like the Goodmans advocated, or a Jacobsian strategy of attrition of automobiles, the fact remains that New York has failed during the half century since in providing much new permanently car-free space.  Only the recent and partial pedestrianization of Times Square stands out.  Manhattan and New York as a whole continue to lack a single pedestrian shopping thoroughfare, such as Buenos Aires' Calle Florida, Copenhagen's Stroget, or Shanghai's Nanjing Road.  As the Auto-Free New York site has recently pointed out, the city failed to even maintain Roosevelt Island, New York's island within an island, as a carfree sanctuary, although it had been planned as one. In spite of these disappointments, it is difficult to think of a better and more appropriate setting for the creation of new pedestrian areas.

Bonus: A Car-free Town That Behaves Like It's Not

Mackinac Island, along with New York's Fire Island, is one of the best-known of America's genuinely car-free summer vacation spots.  Truly living up to its billing, the island does not even have motorized vehicles for mass transit, and instead relies on horse-drawn wagons and bicycles. 

Flickr/andrew.petro
The design of parts of the town, though, is unmistakably 19th century American hypertrophic, with a wide main street that looks much like any other from its era.    Despite the lack of cars, there are raised sidewalks on each side of the street, and a blacktop-paved carriageway.  The street is still designed for the benefit of wheeled vehicles, not people on foot.  Subconsciously obeying these spatial cues, people walking about the town (see photo at right) appear to mostly remain on the sidewalks, while the street itself accommodates wheeled – although not motorized – traffic. So, although the town is in fact car-free, this has meant less than might be expected in terms of how people make use of public urban space.  

The example of Mackinac Island shows that the absence of cars, alone, is not necessarily sufficient to create a pedestrian-friendly urban space.  Design matters too.