Monday, May 28, 2012

Transit Types and Modal Share: More Numbers

I've put together three additional charts, correlating per capita highways, heavy rail and light rail with commuting transit share for an expanded list of thirty American cities, in the hope that these statistics might add to and shed light on the results from the previous post.  Although the first two charts are probably in line with most expectations, the third, for light rail, may come as somewhat of a surprise.

First, here are highway lane miles per capita plotted against commuting transit modal share, using highway and population data from the Federal Highway Administration (h/t Walkable DFW):

As might be expected, there is a correlation between decreasing freeway lane miles and increasing transit modal share, but it is not strong.  Eliminate the three outliers of Kansas City, St. Louis and New York, and even that modest correlation is cut in half.

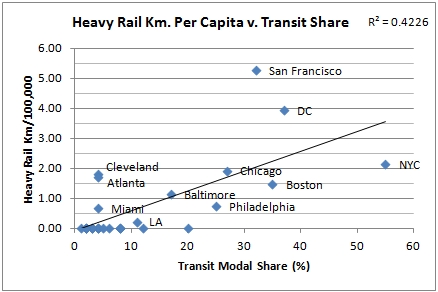
By contrast, the correlation between transit share and kilometers of heavy rail is much more robust.  For this chart, only urban heavy rail systems, such as subways, were included. Regional commuter rail, such as New York's Long Island Railroad or San Diego's Coaster line, is excluded to keep the comparison consistent:


Eliminating the cities with no heavy rail from the sample reduces the correlation to an R2 value of .17.

Last, and perhaps most surprising, are the light rail numbers.  Regardless of whether cities with no light rail are included, there is a statistically insignificant (but consistently negative) correlation between light rail kilometers per capita and transit share.  The United States seems to be flush with cities with substantial light rail networks and low transit modal share.  The exceptions are the cities which also have heavy rail networks (SF, Philadelphia and Boston).  Three other heavy hitters have no light rail, although all had systems in the past (NYC, DC and Chicago):


Two cities with no or essentially no light rail at all, Milwaukee and Detroit, surpass numerous other cities with extensive networks.  Portland's extensive system, more than five times larger than Seattle's on a per capita basis, has only earned it 60 percent of that city's modal share (arguably, Seattle should be given an even lower value on this chart, as the King County branch of its light rail system opened more than halfway through 2009, the year measured by the ACS in computing modal share data).

Are there any further points to glean here?  Certainly no correlation shown here approaches the correlation of urban population density to modal share that I provided in the previous post, which remains by far the strongest correlate of transit use. The role of bus networks is obviously huge, but I wasn't able to find a single metric useful in making cross comparisons that was available for all bus operators (routes per capita is a possibility, but there is no way of knowing the length of these routes in most cases.  I might add it in later anyways, if I can locate the data for it). Commuter rail would introduce more complexities.

Chart data are below.  Numbers in the last three columns show miles and kilometers per capita (per 1,000 or 100,000).  Note that modal share data are for cities, rather than the greater urban areas from which population figures used to compute per capita highway and rail figures are drawn, but are more closely tied to the types of urban transit systems I have included.  You are welcome to reuse this information, but no guarantee of accuracy is offered.  Contact me if you'd like the excel file.

Sources:
DOT: Highway Statistics 2007
2009 ACS via The Transport Politic
Wikipedia (for light and heavy rail statistics)

Related posts: 
Chris Bradford: The association between density and mode of commute. Chris finds that standard density is weakly predictive of transit modal share, but weighted, or perceived, density is strongly correlated with it.
Laurence Aurbach: Fun with Density and Transit Statistics.

Saturday, May 26, 2012

Density and Transit: Some Numbers

Note: Updated 5/29 with an expanded list of cities.  This has slightly weakened each of the correlations.

I've posted on density-related issues several times, including the relationship between height and density, building footprints and density, and street width and density, but I haven't said much about density and transit use.  Cap'n Transit has, though, recently writing a series of posts skeptical of the notion that certain areas "don't have the population density to support transit."

I think the Cap'n is right that this statement, as it's phrased, isn't all that helpful in clarifying the issue.  Instead, in all or virtually all cities, the presence of public transit is a matter of political will – in low-density Arlington, TX, the largest American city without public transportation, only political opposition has stood in the way of the establishment of a bus network. Whether the system would be profitable is presumably only one of several factors in the debate.  Below some point of total population or density, we might be confident in saying the economics would forbid any political consideration of public transportation, but that line is not a bright one.  Private mass transit is more directly tied to profitability, but this in turn is affected by political choices, both toward the private operators themselves and to competing forms of transit (which, as Cap'n has pointed out, includes cars).

A more interesting question, to me, is whether we can say anything more broadly about the relationship between density, both of population and jobs, and transit modal share. The chart I've put together below plots the residential density of a group of the largest American cities, measured by urban area, against commuting transit modal share, using data from the 2009 ACS (raw data is further down):

While there are a few transit overachievers, notably Portland, Seattle, Boston and Washington D.C., the correlation is overall very strong.  No city with an overall density of less than 4,000 per square mile, and there are many, has broken a 10 percent commuting modal share.  The most notable outlier, Miami, may possibly be explained by examining its CBD employment density and job concentration in the charts below.
  
Here is the same exercise, but using the employment density of each city's central business district (in thousands per square mile) in place of residential density:


A similar correlation is there, but it is not quite as strong.  Cities can build equally dense downtown employment districts with almost any level of transit share – cf. Dallas (4), Los Angeles (11), Philadelphia (25) and San Francisco (32).  Again, however, those cities with lower employment densities have difficulty attaining higher mode shares (the cutoff point appears to be around 100,000 jobs per square mi.).


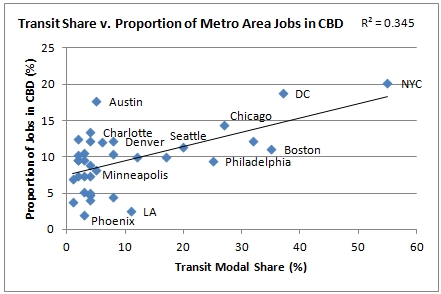
Finally, a comparison substituting employment centralization (proportion of all jobs in the metro area located in the CBD) for employment density:


The correlation is by far the weakest here – a dense, polycentric city can achieve reasonably transit high modal share – but highly monocentric cities appear to have an easier time boosting transit use. Low density monocentric cities fare poorly. (Interestingly, Washington DC, much criticized for the economic effects of its height limit, which has allegedly driven jobs outward to edge cities such as Tyson's Corner, is the second most job-centralized of large American cities. High-rise Dallas and Atlanta, by contrast, are heavily decentralized).

The lesson here seems to be that, when it comes to increasing the share of city residents using transit residential density is a key, if not the key, factor.  It may also increase the financial viability of the transit service, although it is possible that mode share and transit expenses are also closely correlated.  That, and some other possible comparisons, will have to wait for another post. 


Employment data from 2000 Demographia studymode share data from 2009 ACS via The Transport Politic.

Friday, May 4, 2012

Bikes, Transit and Traditional Urbanism

Back in 2010, Nathan Lewis published what is one of the few pro-urban critiques of transportational bicycling available on the net. In the piece, he calls into question the assumption that increasing rates of urban bicycling, or increased provision for bicycle infrastructure, are necessarily beneficial for pedestrian-centric traditional urbanism.

One of the greatest dangers, Nathan writes, is that a city consciously designs itself around the bicycle, while neglecting the needs of people on foot. It is not a groundless concern: the blog Half the Fun critiques (with photos) the Dutch city of Houten, which was designed entirely around bicycles, for having "lost sight of the forest for the trees" by its focus on cycling rather than on "creat[ing] better, more livable communities."

The article concedes that "more bikes on the road would lessen just about every transportation problem you can
A growing storage problem: bicycle parking by a transit
station, Copenhagen (Leif Jørgensen).
think of," but I think that is true only where a new bike trip replaces a trip by car. Replacing a walking trip or a transit trip is less obviously beneficial from a citywide perspective, since the bicycle introduces potential conflicts with pedestrians and presents parking issues that differ only in scale from those of cars. A review of European transportation initiatives, however, shows a frequent focus on increasing bicycle use and modal share, rather than simply decreasing automobile share, with the unstated assumption that the added bicycle riders will be drawn largely or exclusively from the pool of car drivers.*

That may not always be the case. Although evidence isn’t abundant, one study in the Danish city of Odense found that, during the mid to late-1990s, although the share of all trips taken by bicycles rose from 22.5 to 24.6%, this was accompanied by decline in the share of public transportation from 8.2 to 6.6%. By contrast, in Portland, a recent increase in bicycling share appears to have been drawn at least as much from the driving population as from transit riders. This question of whether increased funding for bike infrastructure indirectly results in the decline or stagnation of a city's own transit ridership should be of interest to municipal transportation agencies.

Based on commuting modal share statistics, it is not always easy to tell the extent to which new cycling trips have displaced transit and walking trips, car trips or both. Consider the dramatically different commuting mode shares of four European cities, each of which has taken a somewhat different approach toward transportation, while all having near-identical rates of car commuting:
 
On first glance, it's not easy to explain the differences between cities like Copenhagen and Vienna. Both are national capitals of similarly sized countries with similar metro populations and mass transit networks that include extensive subway systems.  Vienna is denser than Copenhagen, which may in part explain the much higher walking share, but we see that despite Copenhagen's immense pro-cycling efforts (so extensive that they have given their name to a popular pro-bicycling movement), its car share is only slightly less.  Vienna, by contrast, has a much more modest goal of increasing bike share to eight percent, but has primarily focused on improving transit share.

In fact, the results over time for both cities show that transit share hasn't budged, even though Copenhagen's metro entered service in the middle of the time period below (Vienna's U-Bahn has undergone recent expansion but much of the system, which opened in 1976, predates 1993).  Is it possible that pro-cycling efforts siphoned off potential transit riders in Copenhagen?  And if so, was this beneficial for the city?


Vienna street: pedestrian-centric design,
not friendly to bikes (Flickr/PaulLamere)
Vienna met its own earlier cycling share goals, but even more significant was the increase in walking share, which far exceeded expectations even though walking is hardly mentioned in Vienna's 1993 transport agenda.  What Vienna had in abundance, after all, was dense, traditional urbanism the ultimate pedestrian infrastructure.  Through restrictions on cars, the city streets again became pleasant places to be, inducing walking far more than expected.  Copenhagen implemented similar policies, yet saw a decline in its already low walk share. 

Still, it is difficult to be too critical of increased bicycle use.  By the standard of almost any American city, Copenhagen's achievement in reducing modal share for cars is remarkable.  The bicycle, too, is an almost magical technology, the sole transportation method devised by man which has improved on the energy efficiency of walking, and one which expands the range of choices for city dwellers.

But is it enough to consider the impact of bikes on the natural environment? Shouldn't their cumulative impact on the urban environment be considered as well?  This will involve issues not only of parking ever-larger numbers of bikes as their popularity grows, but of compatibility with walking and mass transit, and of a city's vision for the interaction between the various modes of urban transport.

One final mode share chart, for New York:


The cycling share may seem surprisingly low, but consider what a bicycle is worth in the city: although it may improve mobility as compared to walking alone, it also essentially locks the bicyclist out of New York's entire public and private transit system (MTA and taxi service), all of which is implicitly designed around the person on foot (sure, there is the Metrobike and other folding bikes, but their appeal is limited and practical difficulties remain).  With the transit system running 24 hours a day, even the ready availability of the bicycle ceases to be an advantage.

All this suggests that as a city's mass transit system improves its frequency, coverage and hours, the value of a bicycle for urban mobility should decrease until, in the case of New York, it reaches close to zero for many neighborhoods.  There's room for difference of opinion, but I think this must be seen as a good thing.  Bikes can be an excellent transit gap-filler, in limited number, but may not be as well suited to being the central element of a transit strategy.


*See e.g. Copenhagen ("it is municipal policy that cycling mode share should go up to 40% by 2012 and 50% in 2015"); Groningen (city "promot[es] cycling as the main mode of transportation" with "vast expansion of the cycle network"); Charter of Brussels: (cities pledging to "set of target of at least 15% for the share of cycling in the modal split of trips for 2020").